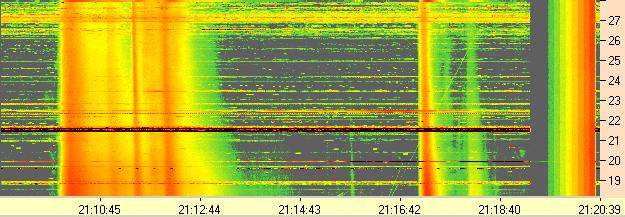
The following spectral views of Solar bursts from a very active sunspot region( 375 ) were made with the Windward Community College Radio Observatory radio spectrograph. This device was developed under a grant from NASA by RF Associates and Radio-Sky Publishing. The instrument sweeps about 10 times per second over a specified frequency range and collects the received signal strength in 200 channels.

The spectral view above shows two terrific groups of flares. The peak intensities for these bursts were measured at about 3.2 million degrees Kelvin equivalent temperature at 20.1 Mhz. In between the flares you will note numerous horizontal lines. These are radio stations that would normally be seen on a spectrogram of this frequency range (18 to 28 MHz) during the day. On the right hand side are vertical bars that are the result of a calibration signal that is injected into the receiver. The brightest red bar corresponds to 6.4 Million degrees. Most of the second burst on this spectrogram was captured on audio at the Big Island Radio Observatory. This wav file is about 730 kilobytes.

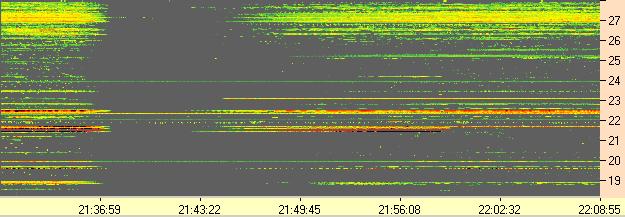
This second spectrogram is the result of an X2 Class X-ray flare that occurred at 2135 UT. X-ray flares may result in a dramatic dropout in the ionosphere's ability to reflect terrestrial radio signals. The X-rays are so energetic that the excite the lower layers of the ionosphere into absorptive state. It may take some time for the ionosphere to return to normal. On this spectrogram you see a black area were only one very strong signal manages to not be obliterated by the phenomenon. It is possible that this signal is being seen by a different mechanism (ground wave) here in Hawaii. The two lighter horizontal lines that cross the spectrogram are an artifact of the receiver electronics.

In addition to attenuation of terrestrial signals, this blackout phenomenon also stops the naturally occurring galactic background radio noise from penetrating to the Earth's surface. Thus if you were listening to a short-wave receiver at the time of the X-ray flare, you would not only notice the loss of any station you were listening to, but also an eerie loss of the static hiss that you would normally hear when you hook up the antenna. The strip chart above shows the dramatic dropout of the background signal level from the 20.1 MHz single frequency receivers at the WCCRO during this X-ray flare.

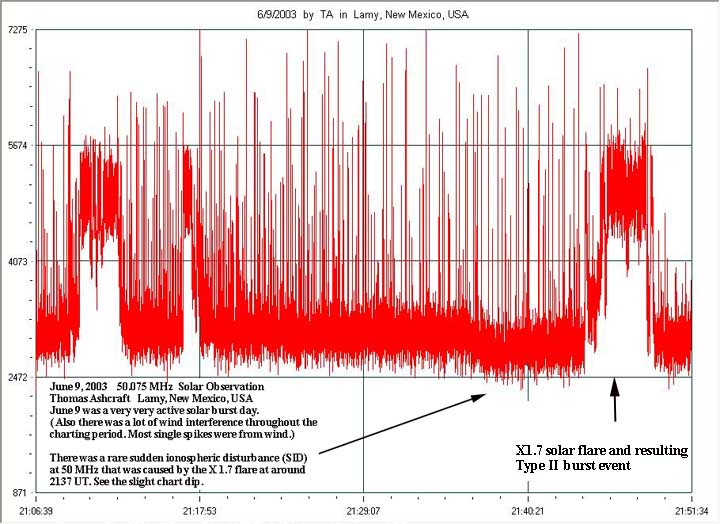
Above is a chart submitted by Tom Ashcraft showing how the phenomena was manifested at 50 MHz. Tom is a veteran observer who notes that these drop outs are quite rare at higher frequencies.
HOME | BEGINNERS | JUPITER | SOLAR | PULSARS | PROJECTS | FAQ | BOOKS | SOFTWARE | SUPPORT | ORDERING | LINKS | EMAIL
updated 6/09/2003