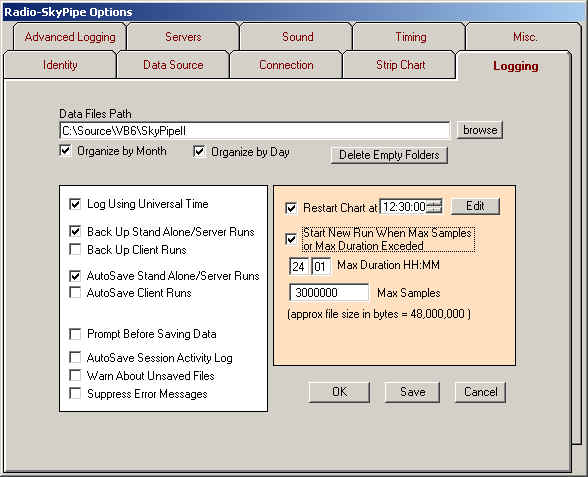
(For our purposes, logging refers to functions related to the storage of data on the R-SP computer.)

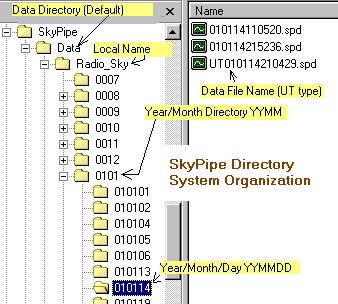
When making large numbers of observations it becomes important to organize your data files in such a way that they can be easily retrieved. AutoSaved files are automatically saved in a Local Name subdirectory of the base directory, (the base directory = Data Files Path [see above]). This keeps data files from different sources from co-mingling. When using the Organize by Month/Day options, the computer automatically stores the files in next level subdirectories based either on the day the file was generated or further sorted into directories based on month and day.

The picture above shows the directory structure when using both the Organize by Month and Organize by Day options. These files were created by the Radio-Sky Jupiter Observatory, locally. The selected files are found under a Month directory (0101) actually also includes year information formatted YYMM). In the directory tree separate directories are also created for individual days for that month (format: YYMMDD). To the right are the data file names which were captured on Jan 14, 2001 (format: YYMMDDHHNNSS.spd where NN represents minutes).
There is nothing sacred about the data file names and they can be renamed (though you should retain the .spd extension), however, it has been found useful to organize files in this manner. The .spd extension will allow the files to be associated with R-SP so that clicking on a file in Windows Explorer or on a web page brings Radio-SkyPipe up as the appropriate viewer for the file. See Associating Radio-SkyPipe Files.
Delete Empty Folders
This button recursively deletes empty file folders in the data directory.
This is handy for removing folders that are created by the program in
anticipation of data files that never get saved.
Log Using Universal Time
Most scientific observations are based on Universal Time (closely related to
Greenwich Mean Time) so that observers all over the world may easily relate when
events actually occur. Selecting Log Using Universal time adds the value
of your time zone to that supplied by your computer clock to the time stamp
associated with each data point. For example the time zone in Hawaii is
-10, so ten hours would be subtracted (adding a minus!) form the time supplied
by my computers clock (my local time). Thus using this option implies that
your computer clock is set to your local time and that you have correctly stated
your time zone on the identity page.
Back Up StandAlone/Server and Client Runs
A separate real-time back up may be saved of your data as it is collected. In
the case of a computer crash, you may use these back up files to recover your
data the next time Radio-SkyPipe is started. Check these back up options to
activate this system. Some performance degradation can occur from using the
backup system. The next time you start R-SP after a crash, you will be presented
with the file names of the backup files saved. These files are located in an
automatically generated recovery directory under you default data directory.
AutoSave Stand Alone/ Server Runs
Automatically save strip charts created when in Stand Alone or
Server Mode. Files are saved using the naming convention: YYMMDDHHNNSS.dat
where YY represents the last to digits of the current year, MM
represents the month number, DD represents the day number in the given
month, HH represents the hour in 24 hour format, NN represents the
minute, and SS represents the second for the time when the strip chart
begins. AutoSave does not over-ride the Prompt Before Saving Option.
AutoSave Client Runs
Automatically save files when running in Client Mode.
Prompt Before Saving
If you select Prompt Before Saving you will be presented with a
dialog box allowing you to modify the name and location of the data you are
saving. You will be prompted even if using the AutoSave options.
AutoSave Session Activity Logs
Automatically save the Session Activity Log each time you run R-SP. While these
logs are not needed under normal circumstances, they may be helpful in
deciphering problems or keeping tabs on otherwise un-monitored activity.
Warn About Unsaved Files
If selected the program will attempt to warn you each time newly collected data
is going to be discarded by a computer user action.
Suppress Messages
Check this option if you run an unattended installation and you want to minimize
the chance that an error message will halt operation waiting for a user
response. If you use this option when it is not necessary to do so you may miss
problems that are arising. These messages should not be confused with messages
generated by Message Manager.
Restart Chart at HH MM SS
You now may have the chart restart
automatically multiple times a day.
Start New Run When Max Samples or Max Duration is Exceeded
When either of these parameters is reached the data is saved and a new run is
automatically begun. If not selected, the program will stop upon reaching these
limits awaiting user intervention. You should never set these limits too high as
performance will suffer and it is possible to run out of computer memory.
Maximum Duration
Enter the maximum length of time in HH:MM:SS format which you would like the
program to collect data before ending or starting a new run (see above).
Maximum Number of Samples
You should set a maximum number of samples which may be
collected before a Save is enforced. Data samples eat up memory. When you use up all
available memory the program will attempt to write samples to the hard
drive. This is a very slow process and will probably degrade performance
significantly. The value you assign to Maximum Number of Samples will depend on
how much memory your computer has and how much of that memory you are willing to
devote to this program. Each sample can
consume about 16 bytes of memory. It is suggested that for computers with
64 megabytes of RAM or less that no more than 50% of the memory be used by this
program. Thus the following table applies:
| Total Available RAM | Suggested Max Number of Samples |
| 16 M | 500000 |
| 32 M | 1000000 |
| 64 M | 2000000 |
If you are using multiple channels (Pro version only) then remember to multiply these values by the number of channels!
The best bet is to be conservative and use even lower values. If you are running two strip charts on the same computer, you should halve these values. An estimated time for the chart duration is presented, but can only be relied upon if the requested sampling rate is achieved.