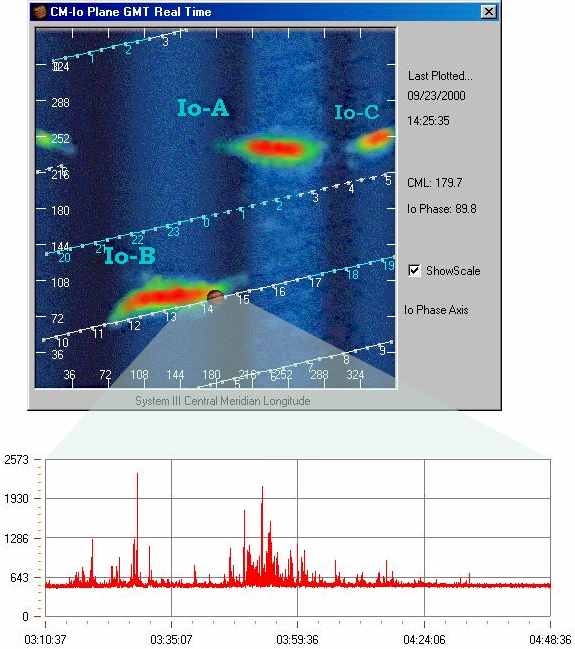
Pictured above is a stripchart of a Jupiter Io B decametric radio noise storm captured at 13:10 UT from the receiver at the Winward Community College Jupiter Observatory in Oahu Hawaii. Note the times on the chart reflect local Hawaii time which is 10 hours less than Universal Time. The chart is mapped to a display from Radio-Jupiter Pro, a Radio-Sky Publishing program. This display plots Jupiter System III Central Meridian Longitude and the position of Io in relation to Jupiter as seen from Earth ( Io Phase ). The brighter areas on the CML-Io Phase chart indicate greater probability of hearing a Jupiter noise storm on Earth. As Jupiter entered the area of the chart near the Io B blob, the noise storm began as predicted. Click on the chart to hear a 4 minute sample of the noise storm in MP3 format (1.8 meg).
HOME | BEGINNERS | JUPITER | SOLAR | PULSARS | PROJECTS | FAQ | BOOKS | SOFTWARE | SUPPORT | ORDERING | LINKS