Data Collection Programs from Radio-Sky
Data Collect Lite 1.0 for DOS
We call this version "Lite", because it is easy on the pocket book from
a hardware and software perspective. Uses your computer and an inexpensive
8, 12, or 16 bit analog to digital converter to produce strip charts and
disk storage of radiotelescope observations. Expand or crop vertical and
horizontal chart scale. Dump the chart to a printer or a PCX file for inclusion
into articles. You can build an 8 or 12 bit converter yourself for about
15 - $25, (we provide you with the schematics), or order a kit. The converter
uses your printer port. We also supply a driver for the Radio-Shack computer
interfaceable DVM. If you are a hardware designer, you can even write your
own printer port interface for your device using a simple to use driver
editor which we provide (16 bit resolution limit!). You get automated observing
when you use DCL 1.0 with Radio-Sky Planetarium 1.2. Data Collect Lite
1.0 can read the schedule files produced by the RSP 1.2 program, and begin
and end data collection at the appropriate times. There is full mouse support,
easy to use on screen documentation, Epson 9 and 24 pin and HP Laser Jet
printer support. VGA, EGA, and CGA monitors supported. MS DOS .
Data Collect Lite for Windows 1.5
A newly updated version of this program was produced for The Radio Sky
CDROM I. The update includes realtime and observation sidereal clocks
(assumes meridian transit observations), support for the Radio Shack
computer interfaced digital volt meter, voltage grid, and numerous bug
fixes from earlier versions. It has the Win95 look, but still also
runs on Win31 so you can use that old 386 with 4 meg of memory with no
problem.

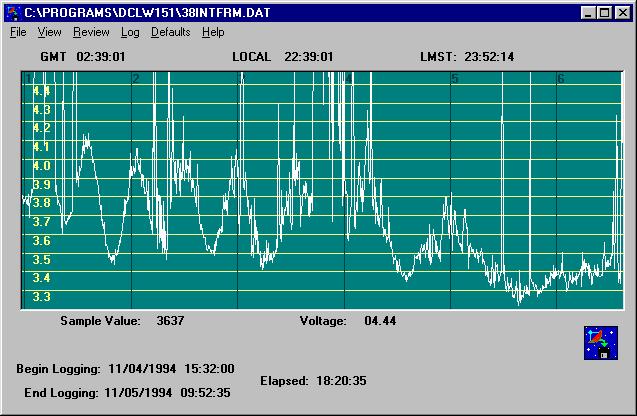
Above is a screen shot of the data screen of an observation made in
1994 using Data Collect Lite. The files are compatible between DOS
and Windows versions. (Some jpeg image artifacts are present). Screen
colors are customizable. Pointing the mouse cursor to a given point on
the graph reveals the voltage, raw sample value, local, gmt, and sidereal
times of the observation. You can zoom in by right clicking the mouse and
dragging a rectangular sub region. Another nifty feature available with
mouse clicks is that you can find the voltage and time differential between
any two points on the graph. This is very handy for interferometer
observations like this one when you want to determine the time between
fringes.

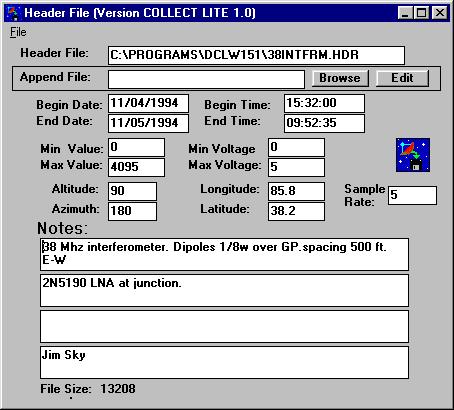
Every observation is represented by two files, a data file, and a header
file. The header file contains information important in interpreting
the data. Additional information can be referenced with an optional
Append file. The data collection program allows editing of header information
and you can launch an unattended observation by placing start and end times
in a header and choosing Log/ User Header.
Additional information is available on this website regarding the building
of two simple and inexpensive analog to
digital converters which can be used by the Data Collect Lite programs.
HOME
| BEGINNERS | JUPITER
| SOLAR | PULSARS
| PROJECTS | FAQ
| BOOKS | SOFTWARE
| SUPPORT | ORDERING
| LINKS | EMAIL


