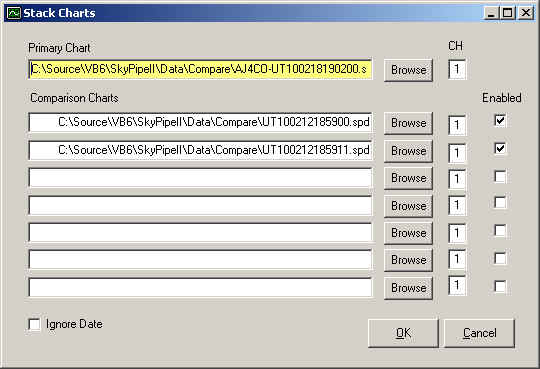

When comparing charts one chart must be selected as Primary. This chart will dictate the allowable time span for all comparison charts. The axis labels for this chart will be retained on the combined chart. The Primary Chart must be placed into the top text box on the Stack Charts window. The Primary Chart will reference the chart loaded into the main Radio-SkyPipe stand alone window if that file was loaded from disk. You may also use the Browse button to find the appropriate file or you may drag the file to the text box from Windows Explorer.
In addition to each channels source file you may also select a channel number from that source file. For example, you might want to use channel 2 of a multi-channel file as the second comparison chart in your list. If you select a channel number that does not exist the comparison will fail. Channel 1 is selected by default.
Comparison Charts also have an Enabled check box. Unchecking this box excludes the corresponding chart from the comparison. The stacked chart will include all enabled channels in the order they are found in the list of files on the Stack Charts window.
An Ignore Date checkbox is found in the lower left of the Stack Charts window. If selected, the tool will attempt to combine charts even if they are from different dates as long as they have coincident times. This is done by altering the date for the comparison charts to match the date of the primary chart.

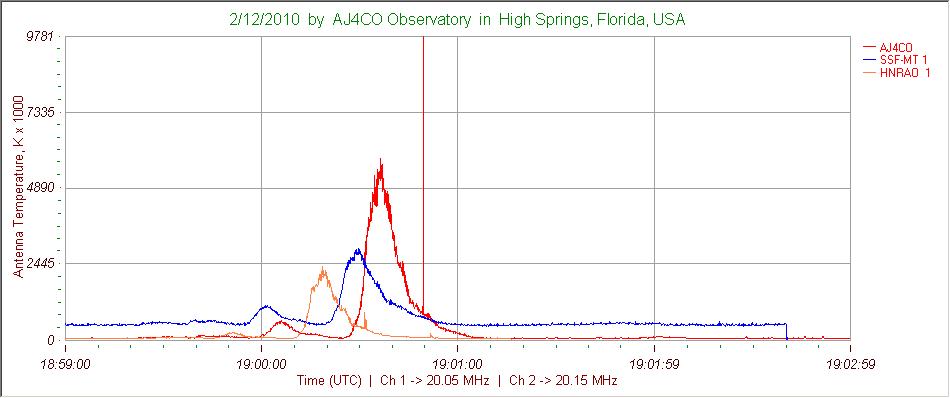
An example of a stacked chart is shown above. These three charts were taken from the Jove Archive using the File / Find in Jove Archive option. Each chart was downloaded into a common folder. The Stack Charts tool was invoked and the files were selected by dragging the files from Windows Explorer into the corresponding text boxes in the Stack Charts window. Clicking OK in the Stack Charts window quickly produced the chart you see. Note that the channel labels in the upper right default to the Local Names of the corresponding charts. Embedded labels are not retained in the comparison charts.
There is no rescaling of the channel data in the stacked chart. Thus it is important that the data be somehow calibrated if the channels are to be compared in amplitude. Only one set of timestamps may be used in a strip chart. Timestamps from the comparison charts are discarded and the channel data is placed in the chart at points that correspond to primary chart timestamps. Alignment is achieved by iterating through the timestamps of the comparison chart and testing to see if the timestamp of the comparison chart is equal to or greater than the next available primary chart timestamp. If so, the data point from the comparison chart is then mapped to the corresponding primary chart timestamp. Comparison chart data points may thus be skipped and all are altered in time to a small degree. This method is thus not recommended for comparisons that require the highest degree of accuracy as samples can me shifted in time by at least one sample period.
Help Index | Radio-Sky Publishing Home