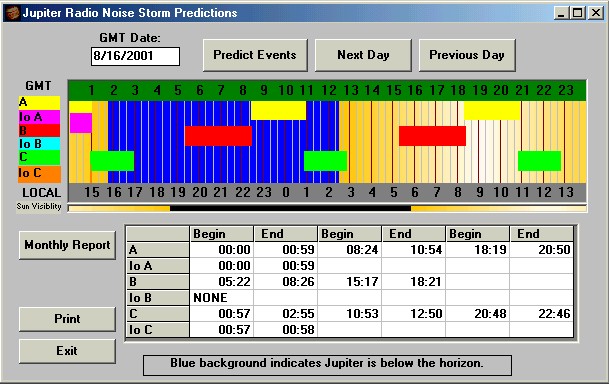
The most important function of the Radio-Jupiter software is it's ability to predict times of higher probability for the reception of Jupiter's decametric noise storms. These predictions are based upon recognized patterns in the reception probability and how it correlates with certain central meridian longitudes of Jupiter and with the position of the moon Io in its orbit around Jupiter. The Io position is commonly referred to as Io Phase. The parameters for the predictions are held in a "mode file". The default mode file is based upon the criteria used by the University of Florida Radio Observatory.
A quick look graph has been developed so that you can see a days activity at a glance. The various modes are color coded onto the graph. A key with the mode names and colors appears at the left of the graph. Time markers exist at 20 minute and hour intervals with scales above and below the graph in GMT and Local hours.

The visibility of Jupiter for your location is readily determined for a given time by the background color of the graph. Blue areas indicate that Jupiter is below the horizon. The yellow to white area(s) indicate Jupiter is above the horizon, with whiter areas roughly indicating a higher elevation in the sky.
Since it is important to also know the position of the Sun when observing Jupiter, a Sun Visibility indicator has been added to the bottom of the graph. Black indicates the Sun is below the horizon and again the relative elevation above the horizon is determined by the whiteness of the bar.
A tabular display of the predicted times appears below the quick view graph. You may produce monthly reports for the month of the indicated date with the Monthly Report button. Next and Previous Day buttons above the graph affect the date accordingly.