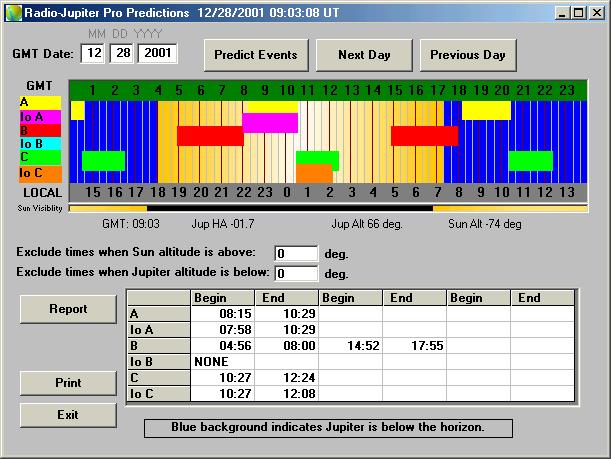
The most important function of the Radio-Jupiter software is it's ability to predict times of higher probability for the reception of Jupiter's decametric noise storms. These predictions are based upon recognized patterns in the reception probability and how it correlates with certain central meridian longitudes of Jupiter and with the position of the moon Io in its orbit around Jupiter. The Io position is commonly referred to as Io Phase. The parameters for the predictions are held in a "mode file". The default mode file is based upon the criteria used by the University of Florida Radio Observatory.
A quick look graph has been developed so that you can see a days activity at a glance. The various modes are color coded onto the graph. A key with the mode names and colors appears at the left of the graph. Time markers exist at 20 minute and hour intervals with scales above and below the graph in GMT and Local hours.

The visibility of Jupiter for your location is readily determined for a given time by the background color of the graph. Blue areas indicate that Jupiter is below the horizon. The yellow to white area(s) indicate Jupiter is above the horizon, with whiter areas roughly indicating a higher elevation in the sky. When you run your cursor across the prediction graph Jupiter altitude, hour angle, as well as Sun altitude values and GMT time are shown for that point on the graph in labels below the graph.
There is also a graphical indicator of the position of the Sun, a Sun Visibility bar, at bottom of the graph. Black indicates the Sun is below the horizon and again the relative elevation above the horizon is determined by the whiteness of the bar.
A tabular display of the predicted times appears below the quick view graph. You may produce monthly reports for the month of the indicated date with the Monthly Report button. See Monthly Report Options for an explanation of report options. Reports are saved as a text file and you are prompted as to whether or not you would like to see the report in Notepad.exe after the report is created. Reports are very handy for scheduling observations.
Next and Previous Day buttons above the graph update the prediction page accordingly.
Limiting based on Elevation
Two entry boxes allow you to exclude times when Jupiter is below a given
elevation or the Sun is above a given elevation. This does not affect the
graphical prediction chart but does affect which items appear in the table and
also limits which predicted events appear in your reports.
The Print button sends the table information to the printer.
A Super Handy Feature!
Normal operation of the Prediction screen does not affect the real time display status of other screens, however, there are times when you may want to view the Sky Map or the CML - Io Phase graphs, for example, for a specific fixed time indicated on the prediction screen. In order to do this, first load the screens you want affect in this manner, then run the Prediction view. Predict for the date you are interested in, then right click with the mouse on the prediction chart on the event you want to see other charts for. Select the option to do so from the one line menu that appears. The program will be changed to fixed time mode and the other screens will reflect the date and time of the prediction you clicked on.